
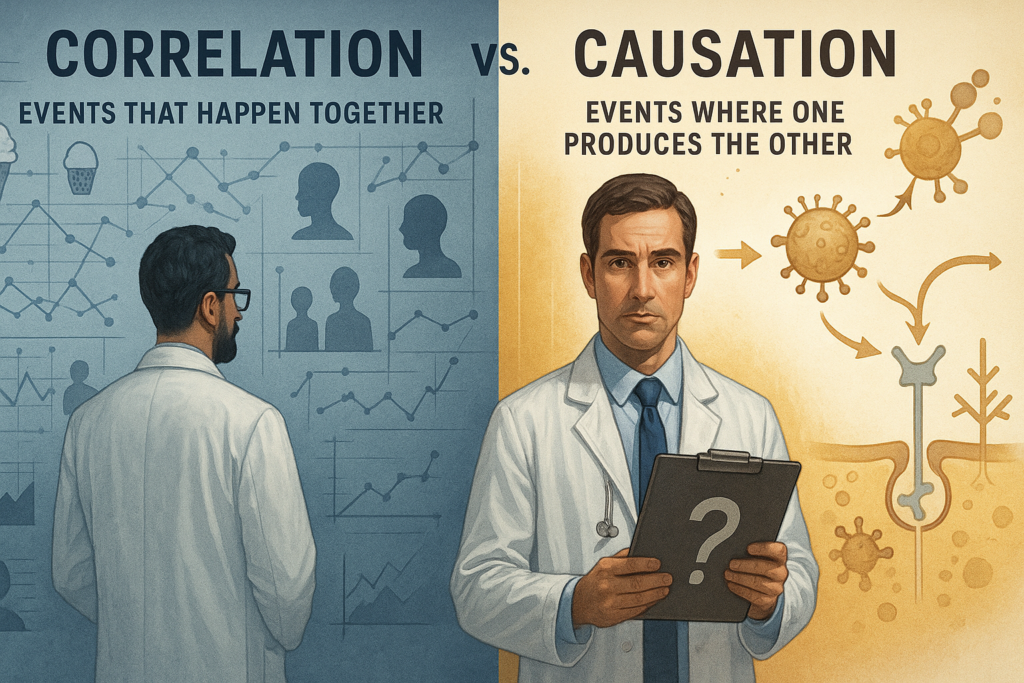
Understanding the Basics
Here’s the fundamental problem: just because two things happen together doesn’t mean one caused the other. When we say two variables are “correlated,” we’re simply observing that they move in tandem—when one goes up, the other tends to go up (or down). Causation, on the other hand, means that a change in one variable directly causes a change in the other. Think of correlation as a suspicious coincidence, while causation is a proven relationship with a clear mechanism.
The tricky part is that our brains are pattern-seeking machines. We evolved to spot connections quickly because that helped our ancestors survive. If you ate those red berries and got sick, better to assume the berries caused it rather than to wait around for a controlled study. But this mental shortcut can seriously mislead us in the modern world, especially when it comes to complex health issues.
Classic Examples That Illustrate the Problem
Let me give you some examples that show how ridiculous this confusion can get when we’re not careful. There’s a famous correlation between ice cream sales and drowning—both increase during summer months, but ice cream isn’t causing drowning. The real driver is warmer weather, which leads people to both buy more ice cream and to spend more time at beaches or swimming pools where drowning might happen. This is what researchers call a “confounding variable”—a third factor that influences both things you’re measuring.
Here’s another head-scratcher: there’s a correlation between the number of master’s degrees awarded and box office revenue. Does getting more education somehow boost movie sales? Of course not. This is what we call a spurious correlation—a completely coincidental relationship that exists in the data but has no meaningful connection in reality.
Here’s good news for us coffee drinkers. For years, studies suggested a correlation between heavy coffee drinking and heart disease. Later research found the real issue: heavy coffee drinkers were also more likely to smoke. Once smoking was controlled for, coffee itself did not increase heart risk.
Perhaps the most amusing example is the correlation between stork populations and birth rates in Germany and Denmark spanning decades. As the stork population fluctuated, so did the number of newborns. Now, you could construct a “Theory of the Stork” claiming that storks deliver babies, but the real explanation probably involves other variables like weather patterns, urbanization, or environmental developments that affected both populations.
The medical field offers more serious examples. You observe a strong correlation between exercise and skin cancer cases—people who exercise more seem to get skin cancer at higher rates. Without digging deeper, you might panic and conclude that exercise somehow causes cancer. But the actual explanation is far more mundane: people who exercise more tend to spend more time outdoors in the sun, which increases their UV exposure. The confounding variable here is sun exposure, not the exercise itself.
The Vaccine-Autism Controversy: A Cautionary Tale
Now let’s talk about one of the most damaging correlation-causation confusions in recent medical history: the claim that vaccines cause autism. Many childhood vaccines are administered at the same ages when numerous developmental conditions first become noticeable—including autism, seizure disorders, and certain metabolic or genetic issues. This is a textbook case of how mistaking correlation for causation can have real-world consequences.
The whole mess started in 1998 when Andrew Wakefield, a gastroenterologist at London’s Royal Free Hospital, published a paper in The Lancet describing 12 children, eight of whom were reported as having developed autism after receiving the MMR vaccine. Here’s the thing: this wasn’t even a proper study that could establish causation. It was described as a consecutive case series with no control group or control period—it was simply a description that couldn’t tell you whether one thing causes another.
But why did this idea catch fire so dramatically? The timing created a perfect storm for correlation-causation confusion. Autism becomes apparent early in childhood, around the same time children receive many vaccines and there will be a temporal relationship by chance alone. Parents naturally searched for explanations, noticed the temporal proximity, and drew what seemed like an obvious conclusion.
The scientific community took these concerns seriously and conducted extensive research. Despite overwhelming data demonstrating that there is no link between vaccines and autism, many parents remain hesitant to immunize their children because of the alleged association. Study after study found no connection. A study of over 500,000 children in Denmark, published in The New England Journal of Medicine in 2002 found no relationship between autism and MMR as did a subsequent Danish study published in 2019. In April 2015, JAMA published a large study analyzing health records of over 95,000 children, including about 2,000 who were at risk for autism because they had a sibling already diagnosed. It confirmed that the MMR vaccine did not increase the risk for autism spectrum disorder.
The original Wakefield study eventually collapsed under scrutiny. The Lancet retracted the article, and Wakefield was found guilty of deliberate fraud—he picked and chose data that suited his case and falsified facts. Wakefield lost his license to practice medicine after being sanctioned by scientific bodies. But by then, the damage was done.
Here’s the correlation-causation issue in stark terms: the prevalence of autism has increased over time, which researchers and healthcare professionals explain is likely due to multiple factors, including people becoming more aware of autism, improved screening, and updated and expanded diagnostic criteria to include other conditions on the autism spectrum. Meanwhile, immunizations have increased and have dramatically reduced the incidence of vaccine-preventable diseases. These two trends—increasing autism diagnoses and increasing vaccination rates—happened to occur during the same historical period, creating an illusory correlation.
The real causes of autism are complex. There is no single root cause; a combination of influences is likely involved, including certain genetic syndromes, genetic changes affecting cell function, and environmental influences such as premature birth, older parents, and illness during pregnancy. Vaccines simply aren’t part of that picture.
Other Health-Related Confusion
The vaccine-autism controversy isn’t the only place where correlation-causation confusion causes problems in health contexts. Let me give you a few more examples that show how pervasive this issue is and how difficult it can be to distinguish between correlation and causation.
Consider the relationship between diet and health outcomes. The amount of sodium a person gets in their diet is closely correlated to the total calories they eat—in other words, the more a person eats, the more sodium they’re likely to take in, and eating a lot of calories often leads to obesity. Both obesity and high-sodium diets are believed to contribute to high blood pressure. So, what’s the primary driver? Is it sodium, excess calories, or obesity? These are exactly the kinds of questions researchers must carefully untangle.
Here’s another tricky one: research has shown a correlation between antibiotic use in children and increased risk of obesity, with greater antibiotic use associated with higher obesity risk, particularly for children with four or more exposures. But this correlation alone doesn’t tell us whether antibiotics cause obesity. There could be multiple explanations: perhaps children who need frequent antibiotics have other health issues that predispose them to weight gain, or perhaps the infections themselves (not the antibiotics) are the real issue, or maybe it’s actually a disruption of gut bacteria that matters. Without understanding the exact physiological mechanism, we can’t design effective interventions.
Similarly, increased BMI seems to be associated with an increased risk of several cancers in adults. But it would be erroneous to conclude that simply being overweight directly causes cancer. Socioeconomic factors, environmental toxins, access to healthcare, lifestyle differences, physical activity levels, and diet all intertwine in complex ways. Some people may face multiple risk factors simultaneously, making it difficult to isolate which factors are most significant.
When cell phones first became widely used, there was an increasing concern that radiation from the cell phones was causing brain cancer. Brain cancer rates have remained stable for decades despite exponential increases in cell-phone use—strong evidence against a causal relationship.
Beyond Statistics
The stakes here go way beyond academic accuracy. When people confuse correlation with causation in health contexts, they make decisions that can harm themselves and others. The 2017 measles epidemic in Minnesota’s Somali community was in no small measure fomented by Wakefield—he didn’t fade away quietly. He and other anti-vaxers repeatedly proselytized to the community, leading to an approximately 45% reduction in vaccination. At the same time there was an increase in autism diagnoses. Think about that: vaccination rates dropped, yet autism diagnoses continued to rise—the exact opposite of what you’d expect if vaccines caused autism. A word of caution: this is an observation, not a carefully controlled study.
The problem extends to how we evaluate new treatments and risk factors. In clinical medicine, there are treatment protocols in use that are not supported by randomized controlled trials. There are risk factors that have been associated with various diseases where it’s difficult to know for certain if they are actually contributing causes. This uncertainty creates space for misunderstanding.
How Scientists Establish Causation
So, how do researchers move from observing a correlation to proving causation? They look for several key elements. These include: a stronger association between variables (which is more suggestive of cause and effect than a weaker one), proper temporality (the alleged effect must follow the suspected cause), a dose-response relationship (where increasing exposure leads to proportionally greater effects), and a biologically plausible mechanism of action.
The gold standard is the randomized controlled trial, where researchers can carefully control for confounding variables by randomly assigning people to treatment and control groups. For ethical reasons, there are limits to controlled studies—it wouldn’t be appropriate to use two comparable groups and have one undergo a harmful activity while the other does not. That’s why we often rely on observational studies combined with careful statistical methods to rule out alternative explanations.
The Bottom Line
Understanding the difference between correlation and causation isn’t just an academic exercise—it’s a critical thinking skill that helps you navigate health claims, news stories, and medical decisions. The vaccine-autism controversy shows how dangerous it can be when we mistake coincidental timing for causal relationships, especially when those misunderstandings spread through communities and lead to preventable disease outbreaks.
The key takeaway? When you see two things happening together, your brain will want to assume one caused the other. Resist that urge. Ask yourself: could there be a third factor driving both? Could the timing just be coincidental? Is there a clear, testable mechanism that would explain how one causes the other? These questions can help you separate meaningful connections from statistical coincidences—and potentially save you from making poor health decisions based on faulty reasoning.

The Price Tag Mystery: Why Nobody Really Knows What Healthcare Costs in America
By John Turley
On January 29, 2026
In Commentary, Medicine, Politics
Imagine walking into a store where nothing has a price tag. When you get to the register, the cashier scans your items and tells you the total—but that total is different for every customer. Your neighbor might pay $50 for the same items that cost you $200. The store won’t tell you why, and you won’t find out until after you’ve already “bought” everything.
Welcome to American healthcare, where the simple question “how much does this cost?” has no simple answer.
You might think I’m exaggerating, but the evidence suggests otherwise. Research published in late 2023 by PatientRightsAdvocate.org found that prices for the same medical procedure can vary by more than 10 times within a single hospital depending on which insurance plan you have, and by as much as 33 times across different hospitals. A knee replacement that costs around $23,170 in Baltimore might run $58,193 in New York. An emergency department visit that one facility charges $486 for might cost $3,549 at another hospital for the identical service.
The fundamental problem is that hospitals and doctors don’t have one price for their services. They have dozens, sometimes hundreds, of different prices for the exact same procedure depending on who’s paying. This bizarre system evolved because most healthcare in America isn’t a simple transaction between patient and provider—there’s a third party in the middle called an insurance company, and that changes everything.
The Fiction of Chargemaster Prices
A hospital chargemaster is essentially the hospital’s internal price list—a massive catalog that assigns a dollar amount to every service, supply, test, medication, and procedure the hospital can bill for, from an aspirin to a complex surgery. These listed prices are usually very high and are not what most patients actually pay; instead, the chargemaster functions as a starting point for negotiations with insurers and government programs like Medicare and Medicaid, which typically pay much lower, pre-set rates. What an individual patient ultimately pays depends on several factors layered on top of the chargemaster price. Think of them like the manufacturer’s suggested retail price on a car: technically real, but nobody pays them.
A hospital might list an MRI at $3,000 or a blood test at $500. But then insurance companies come in. They represent thousands or millions of potential patients, which gives them serious bargaining power. They negotiate with hospitals along these lines: “We’ll send you lots of patients, but only if you give us a discount.” So, the hospital agrees to accept much less—maybe they’ll take $1,200 for that $3,000 MRI or $150 for the blood test. This discounted amount is called the “negotiated rate,” and it’s what the insurance company will really pay.
Here’s where it gets messy: every insurance company negotiates its own rates with every hospital. Blue Cross might negotiate one price, Aetna a different price, UnitedHealthcare yet another. The same exact MRI at the same hospital might be $1,200 for one insurer’s customers and $1,800 for another’s. And these negotiated rates have traditionally been kept secret—treated like confidential business information that gives each party a competitive advantage.
The Write-Off Game
What happens to that difference between the chargemaster price and the negotiated rate? The hospital “writes it off.” That’s accounting language for “we accept that we’re not getting paid this money, and we’re taking it off the books.” If the hospital charged $3,000 but agreed to accept $1,200, they write off $1,800. This isn’t lost money in the normal sense—they never expected to collect it in the first place. The chargemaster prices are inflated specifically because everyone knows discounts are coming. Some hospitals now post “discounted cash prices” that are often far below chargemaster and sometimes even below some negotiated rates. These are sometimes, though not always, offered to uninsured patients, generally referred to as self-pay. There can be a catch—some hospitals require lump-sum payment of the total bill to qualify for the lower price.
According to the American Hospital Association, U.S. hospitals collectively plan to write off approximately $760 billion in billed charges in 2025 across all categories of write-offs. That’s not a typo—$760 billion. These write-offs happen in several different situations. The most common are contractual write-offs, where the provider has agreed to accept less than their list price from insurance companies.
Hospitals have far more write-offs than just contractual. They also write off money for charity care—treating patients who can’t afford to pay anything, and they write off bad debt when patients could pay but don’t. They write off small balances that aren’t worth the administrative cost of collection, and they write off amounts related to various billing errors, denied claims, and coverage disputes. Healthcare providers typically adjust about 10 to 12 percent of their gross revenue due to these various write-offs and claim adjustments.
Why Such Wild Variation?
Even with all these negotiated discounts built into the system, the prices still vary enormously. A 2024 study from the Baker Institute found that for emergency department visits, the price charged by hospitals in the top 10% can be three to seven times higher than the hospitals in the bottom 10% for the identical procedure. Research published in Health Affairs Scholar in early 2025 found that even after adjusting for differences between insurers and procedures, the top 25% of prices across all states is 48 percent higher than the bottom 25% of prices for inpatient services.
Several factors drive this variation. Hospitals in areas with less competition can charge more because insurers have fewer alternatives for negotiation. Prestigious hospitals can demand higher rates because insurers want them in their networks to attract customers. Some insurance companies have more bargaining power than others based on their market share. There’s no central authority setting prices—it’s all private negotiations, hospital by hospital, insurer by insurer, procedure by procedure.
For patients, this creates a nightmare scenario. Even if you have insurance, you usually have no idea what you’ll pay until after you’ve received care. Your out-of-pocket costs depend on your deductible (the amount you pay before insurance kicks in), your copay or coinsurance (your share after insurance starts paying), and whether the negotiated rate between your specific insurance and that specific hospital is high or low. Two people with different insurance plans getting the same procedure at the same hospital on the same day can end up with drastically different bills.
Research using new transparency data confirms this isn’t just anecdotal. A study from early 2025 found that for something as routine as a common office visit, mean prices ranged from $82 with Aetna to $115 with UnitedHealth. Within individual insurance companies, the price of the top 25% of office visits was 20 to 50 percent higher than the bottom 25%, meaning even within one insurer’s network, where you go or where you live makes a huge difference.
The Government Steps In
The federal government finally said “enough” and started requiring transparency. Since 2021, hospitals must post their prices online, including what they’ve negotiated with each insurance company. The Centers for Medicare and Medicaid Services (CMS) strengthened these requirements in 2024, mandating standardized formats and increasing enforcement. Health insurance plans face similar requirements to disclose their negotiated rates.
The theory was straightforward: if patients could see prices ahead of time, they could shop around, which would force prices down through competition. CMS estimated this could save as much as $80 billion by 2025. The idea seemed sound—transparency works in other markets, so why not healthcare?
In practice, it’s been messy. A Government Accountability Office (GAO) report from October 2024 found that while hospitals are posting data, stakeholders like health plans and employers have raised serious concerns about data quality. They’ve encountered inconsistent file formats, extremely complex pricing structures, and data that appears to be incomplete or possibly inaccurate. Even when hospitals post the required information, it’s often so convoluted that comparing prices across facilities becomes nearly impossible for average consumers.
An Office of Inspector General report from November 2024 found that not all selected hospitals were complying with the transparency requirements in the first place. And CMS still doesn’t have robust mechanisms to verify whether the data being posted is accurate and complete. The GAO recommended that CMS assess whether hospital pricing data are sufficiently complete and accurate to be usable, and to assess if additional enforcement if needed.
Imagine trying to comparison shop when one store lists prices in dollars, another in euros, and a third uses a proprietary currency they invented. That’s roughly where we are with healthcare price data—technically available, but practically unusable for most people trying to make informed decisions.
The Trump administration in 2025 signed a new executive order aimed at strengthening enforcement of price transparency rules and directing agencies to standardize and make hospital and insurer pricing information more accessible; this action built on rather than reduced the earlier requirements. Hopefully this will improve the ability of patients to access real costs, but it is my opinion that the industry will continue to resist full and open compliance.
The Limits of Shopping for Healthcare
There’s also a deeper philosophical problem: for healthcare to work like a normal market where price transparency drives competition, patients would need to be able to shop around based on price. That could work for scheduled procedures like knee replacements, colonoscopies, or elective surgeries. You have time to research, compare, and choose.
But it doesn’t work at all when you’re having a heart attack, or your child breaks their arm. You go to the nearest hospital, period. You’re not calling around asking about prices while someone’s having a medical emergency. Even for non-emergencies, choosing based on price assumes equal quality across providers, which isn’t always true and is even harder to assess than price itself.
A study on price transparency tools found mixed results on whether they truly reduce spending. Some research shows modest savings when people use price comparison tools for shoppable services like imaging and lab work. But utilization of these tools remains low, and for many healthcare encounters, price shopping simply isn’t practical or appropriate.
Who Really Knows?
So, who truly understands what things cost in this system? Hospital administrators know what different insurers pay them for specific procedures, but that knowledge is limited to their facility. They don’t necessarily know what other hospitals charge. Insurance company executives know what they’ve negotiated with various hospitals in their network, but they haven’t historically shared meaningful price information with their customers in advance. And they don’t know what their competitors have negotiated.
Patients, caught in the middle, often find out their costs only when they receive a bill weeks after treatment. By that point, the care has been delivered, and the financial damage is done. Recent surveys suggest that surprise medical bills remain a significant problem, with many patients receiving unexpected charges from out-of-network providers they didn’t choose or even know were involved in their care.
The people who are starting to get a comprehensive view are researchers and policymakers analyzing the newly available transparency data. Studies published in 2024 and 2025 using these data have given us unprecedented visibility into pricing patterns and variation. But this is aggregate, statistical knowledge—it helps us understand the system but doesn’t necessarily help individual patients figure out what they’ll pay for a specific procedure.
Where We Stand
The transparency regulations represent a genuine attempt to inject some market discipline into healthcare pricing. Making negotiated rates public breaks down the information asymmetry that has allowed prices to vary so wildly. In theory, if patients and employers can see that Hospital A charges twice what Hospital B does for the same procedure, competitive pressure should push prices toward the lower end.
There’s some early evidence this might be working. A study of children’s hospitals found that price variation for common imaging procedures decreased by about 19 percent between 2023 and 2024, though overall prices continued rising. Whether this trend will continue and expand to other types of facilities remains to be seen. I am concerned that rather than lowering overall prices it may cause hospitals at the lower end to raise their prices closer to those at the higher end.
Significant obstacles remain. The data quality issues need resolution before the information becomes truly usable. Many patients lack either the time, expertise, or practical ability to shop based on price. And the fundamental structure of American healthcare—with its complex interplay of providers, insurers, pharmacy benefit managers, and government programs—means that even perfect price transparency won’t create a simple, straightforward market.
So, to return to the original question: does anyone truly know the cost of medical care in the United States? In an aggregate sense, researchers and policymakers are starting to understand the patterns thanks to transparency requirements. The data are revealing just how variable and opaque pricing has been. But as a practical matter for individual patients trying to figure out what they’ll pay for needed care, not really. The information is becoming available but remains largely inaccessible or incomprehensible for ordinary people trying to make informed healthcare decisions.
The $760 billion in annual write-offs tells you everything you need to know: the posted prices are largely fictional, the negotiated prices vary wildly, and the system has evolved to be so complex that even the people operating within it struggle to understand the full picture. We’re making progress toward transparency, but we’re a long way from a healthcare system where patients can confidently get the answer to the simple question: “How much will this cost?”
A closing thought: All of this could be solved by development of a single-payer healthcare system such as I proposed in my previous post America’s Healthcare Paradox: Why We Pay Double and Get Less.